 |
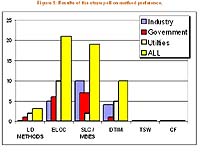
Washington DC (SPX) May 12, 2008 As utilities work to meet electricity demand, especially during peak summer days, examining the relationship between demand and solar photovoltaic (PV) output can be of significant value to the utility industry. Over the years, energy researchers have developed different statistical methods for calculating this relationship. However, there is no consensus across the utility or solar industries on a statistical method for calculating the capacity value of PV or its practical use in electricity markets and utility planning. The new report, Photovoltaic Capacity Valuation Methods, released by the Solar Electric Power Association (SEPA) in consultation with project partners, and funded in part by the U.S. Department of Energy's Solar America Initiative, examines the variety of capacity calculation methods in use, and lays the foundation for building consensus within the solar industry, electric utility, and research communities. Utilities use a variety of means to plan and manage the electricity grid to meet consumer demand, traditionally by managing a dispatchable centralized generation and transmission grid. PV technologies have an intuitively positive relationship with peak electrical demand even though their output can fluctuate-hot summer days with significant air conditioning load are often the most productive for generating solar electricity. Despite this qualitative relationship, there isn't consensus on the most appropriate quantitative method or their use within the utility industry. "As the PV industry continues to grow rapidly in the United States, integrating renewable technologies into the utility grid management and economic valuation process is an important step in recognizing the value-added benefits that PV can contribute," stated Mike Taylor, SEPA's director of research. The new research report catalogues the different methods in existence and provides standardized case studies to examine their relationship to one another at three locations across the United States: Nevada, New York, and Oregon. The more statistically advanced methods at a 5% PV penetration show a capacity value between 60-80% in Nevada, 40-60% in New York, and 10-25% in Oregon. By developing an agreed upon framework for accurately and appropriately calculating photovoltaic capacity, and determining the risk of variation, a means will be provided for utilities and PV generators to innovate around the new economic propositions that will emerge from a recognized method. "This report represents the first step in an ongoing process between the utility and solar industries," according to Taylor. "Additional research areas and collaborative needs were identified that will be valuable in continuing this dialogue with the utility industry." Related Links Solar Electric Power Association (SEPA) Full report All About Solar Energy at SolarDaily.com
 Taipei, Taiwan (SPX) May 12, 2008
With more than 300 international exhibitors signed up to attend, this year's Photonics Festival at the Taipei World Trade Center showcased again Taiwan's dominant position in many sectors of photonic technology and manufacturing. |
|
| The content herein, unless otherwise known to be public domain, are Copyright Space.TV Corporation. AFP and UPI Wire Stories are copyright Agence France-Presse and United Press International. ESA Portal Reports are copyright European Space Agency. All NASA sourced material is public domain. Additional copyrights may apply in whole or part to other bona fide parties. Advertising does not imply endorsement, agreement or approval of any opinions, statements or information provided by Space.TV Corp on any Web page published or hosted by Space.TV Corp. Privacy Statement |